How To Find Your Plant Hardiness Zone
Knowing your plant hardiness zone is one of the first steps you should take when planning your garden. It might seem obvious, but when you’re choosing what to plant, it’s important to make sure it can survive.
Thankfully, there’s an easy system in place to account for this! A simple zone range is printed on the labels for plants and seed packets. This is the hardiness zone, sometimes just called ‘planting zone’ or ‘USDA zone’. As long as your garden is located inside that range, that plant will survive the average temperatures there. Since we’re dealing with averages, give yourself a little cushion when you’re planning more permanent additions to your garden. It would be a shame to invest in trees only to lose them if it gets a little too cold.
Maps labeling these zones are published for every region of the world. For this post, I’m focusing on the region I’m familiar with. But if you’re outside the US & Canada, you can usually find this information from your country’s agricultural bureau or horticultural society.
United States
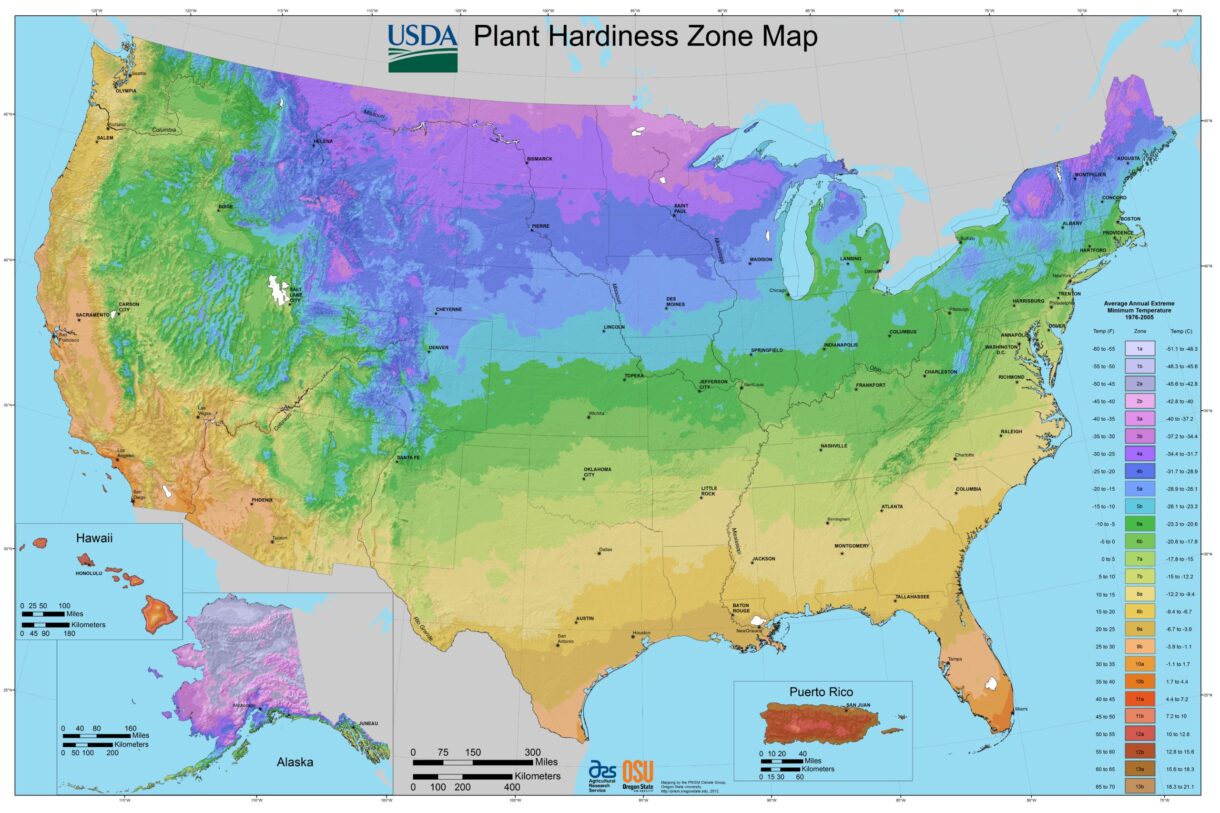
The U.S. Department of Agriculture publishes this information. You can find a larger version of the map from the top of this post on the USDA website. They also have a handy zip code lookup tool and other interactive pages.
One important thing to keep in mind is that the USDA’s zone system is based on the average minimum temperature. Some places in the same zone might have way hotter summers than others, be more prone to drought, or be more likely to experience severe weather. Since it’s an average, that means some winters will be warmer, but some might be colder.
Canada
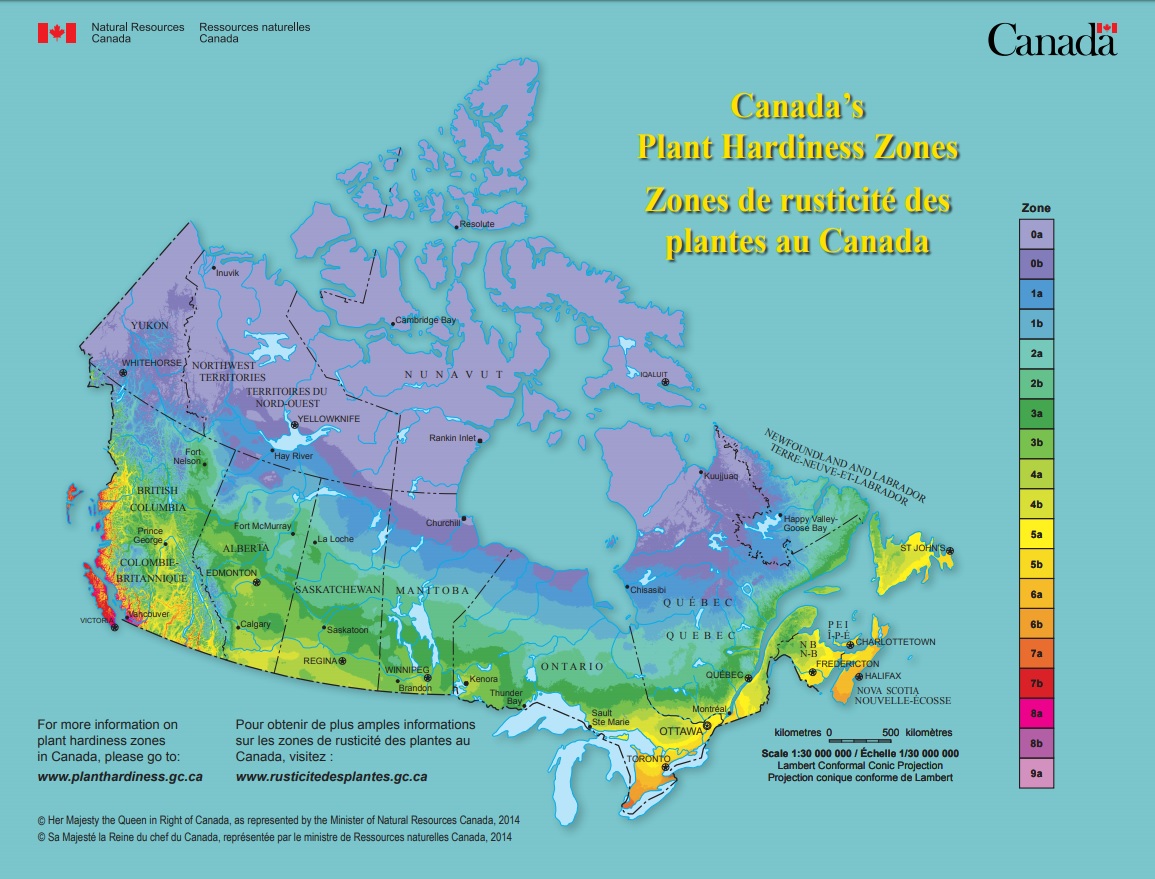
For our friendly northern neighbors up in Canada, Natural Resources Canada publishes a similar map of plant hardiness zones (and their site also provides a location-based lookup tool). However, the standard Canadian map is based on more than just temperature. It accounts for other climate suitability factors, like average annual rainfall. If you need a map based purely on minimum temperatures, they publish a separate map with only that information.
